Midterm Election Guide
Task
As a passion project, this guide started as a genuine desire to better understand today’s political landscape. The goal was to help others, particularly millennials, understand what is at stake with voting in midterms (and why they should be more politically active). The focus on millennials (and the first wave of Gen Z) was because of the widely cited fact that young voters had a significantly lower turnout in the 2016 election than other age groups. Yet, they are also now the largest voter block. The project was co-created with one of my graphic design students, Christina Popik (QU’ 19).
Although this guide was designed to educate and engage millennials in their right to vote, the information presented is for ANY voter looking to understand where we stand at 2018 midterm time amidst a rapid and often confusing news cycle.
Process
As part of the Quinnipiac University community, Christina and I were very familiar with the reputable Quinnipiac Poll and their frequent political data releases (many students are pollers). I decided that the polling releases offered a good starting point to get a feel for the top-of-mind topics in public and would likely factor into elections. While the releases offer excellent detailed longitudinal datasets and demographic information, people need to WANT to rummage through it all to gain any insights. The text-heavy releases felt like an opportunity to make the information more accessible and appealing to an ordinary citizen.
With an idea of the topics most commonly in the polling mix, Christina and I set out to better understand college-aged people. We conducted a brief survey to gauge top concerns, level of political engagement, and potential contributors to that level of political engagement. Our results revealed that the top reason for not voting consistently (or at all) was feeling like they did not know about the country’s issues. However, they identified several general topics as important to them, including immigration, gun control, treatment of minority groups, women’s rights, foreign policy, healthcare, and the environment. Many also indicated confusion surrounding what exactly the processes and implications of the midterm elections are.
With a better understanding of the audience, Christina and I began flagging relevant QU Poll questions on every national poll since the summer before the 2016 presidential election to track responses over time, by age group. The QU polling data was supplemented with Pew Research Center data and others to vary sources and samples. A considerable amount of data was gathered, cleaned, and visualized in Tableau to create over 75 total graphics.
To contextualize the data and help bring further meaning, key political terms and policies were defined by topic. A timeline of events and policies under the Trump administration line the bottom of pages to help understand the relationship between what was happening and how the public felt about it. Finally, whenever possible, data related to the topic on a global scale is presented at the end of each section to understand the US’s place on the world stage.
An icon system and color palette were designed to distinguish the different topics. A closing section explains the midterm election process, seats, scenario possibilities, and voter registration information.
Outcomes
In the months leading to the midterms, the guide was featured as part of AIGA’s Design for Democracy campaign, and served as a cornerstone of the first-ever Quinnipiac University campus-wide Voter Engagement Initiative. A “mini” guide was created for easy distribution among college students, and new visuals continue to be created as data becomes available.
Award
Silver, Connecticut Art Directors Club 2019 Awards Show
Related Presentations
“Information Design and Voter Education: A Reflection on the 2018 Midterms and How to Design for 2020” at Merrimack Design Incubation Colloquium.
“Building Brand Recognition: How Presidential Candidates are Harnessing the Power of Design and Visual Rhetoric” co-presented with Dr. Lisa Burns at NCA.
A typical poll is released as a summary cover sheet followed by pages of response data broken down by question, demographic information and date.
Each topic within the guide begins with key terms and policies valuable to understanding the data.
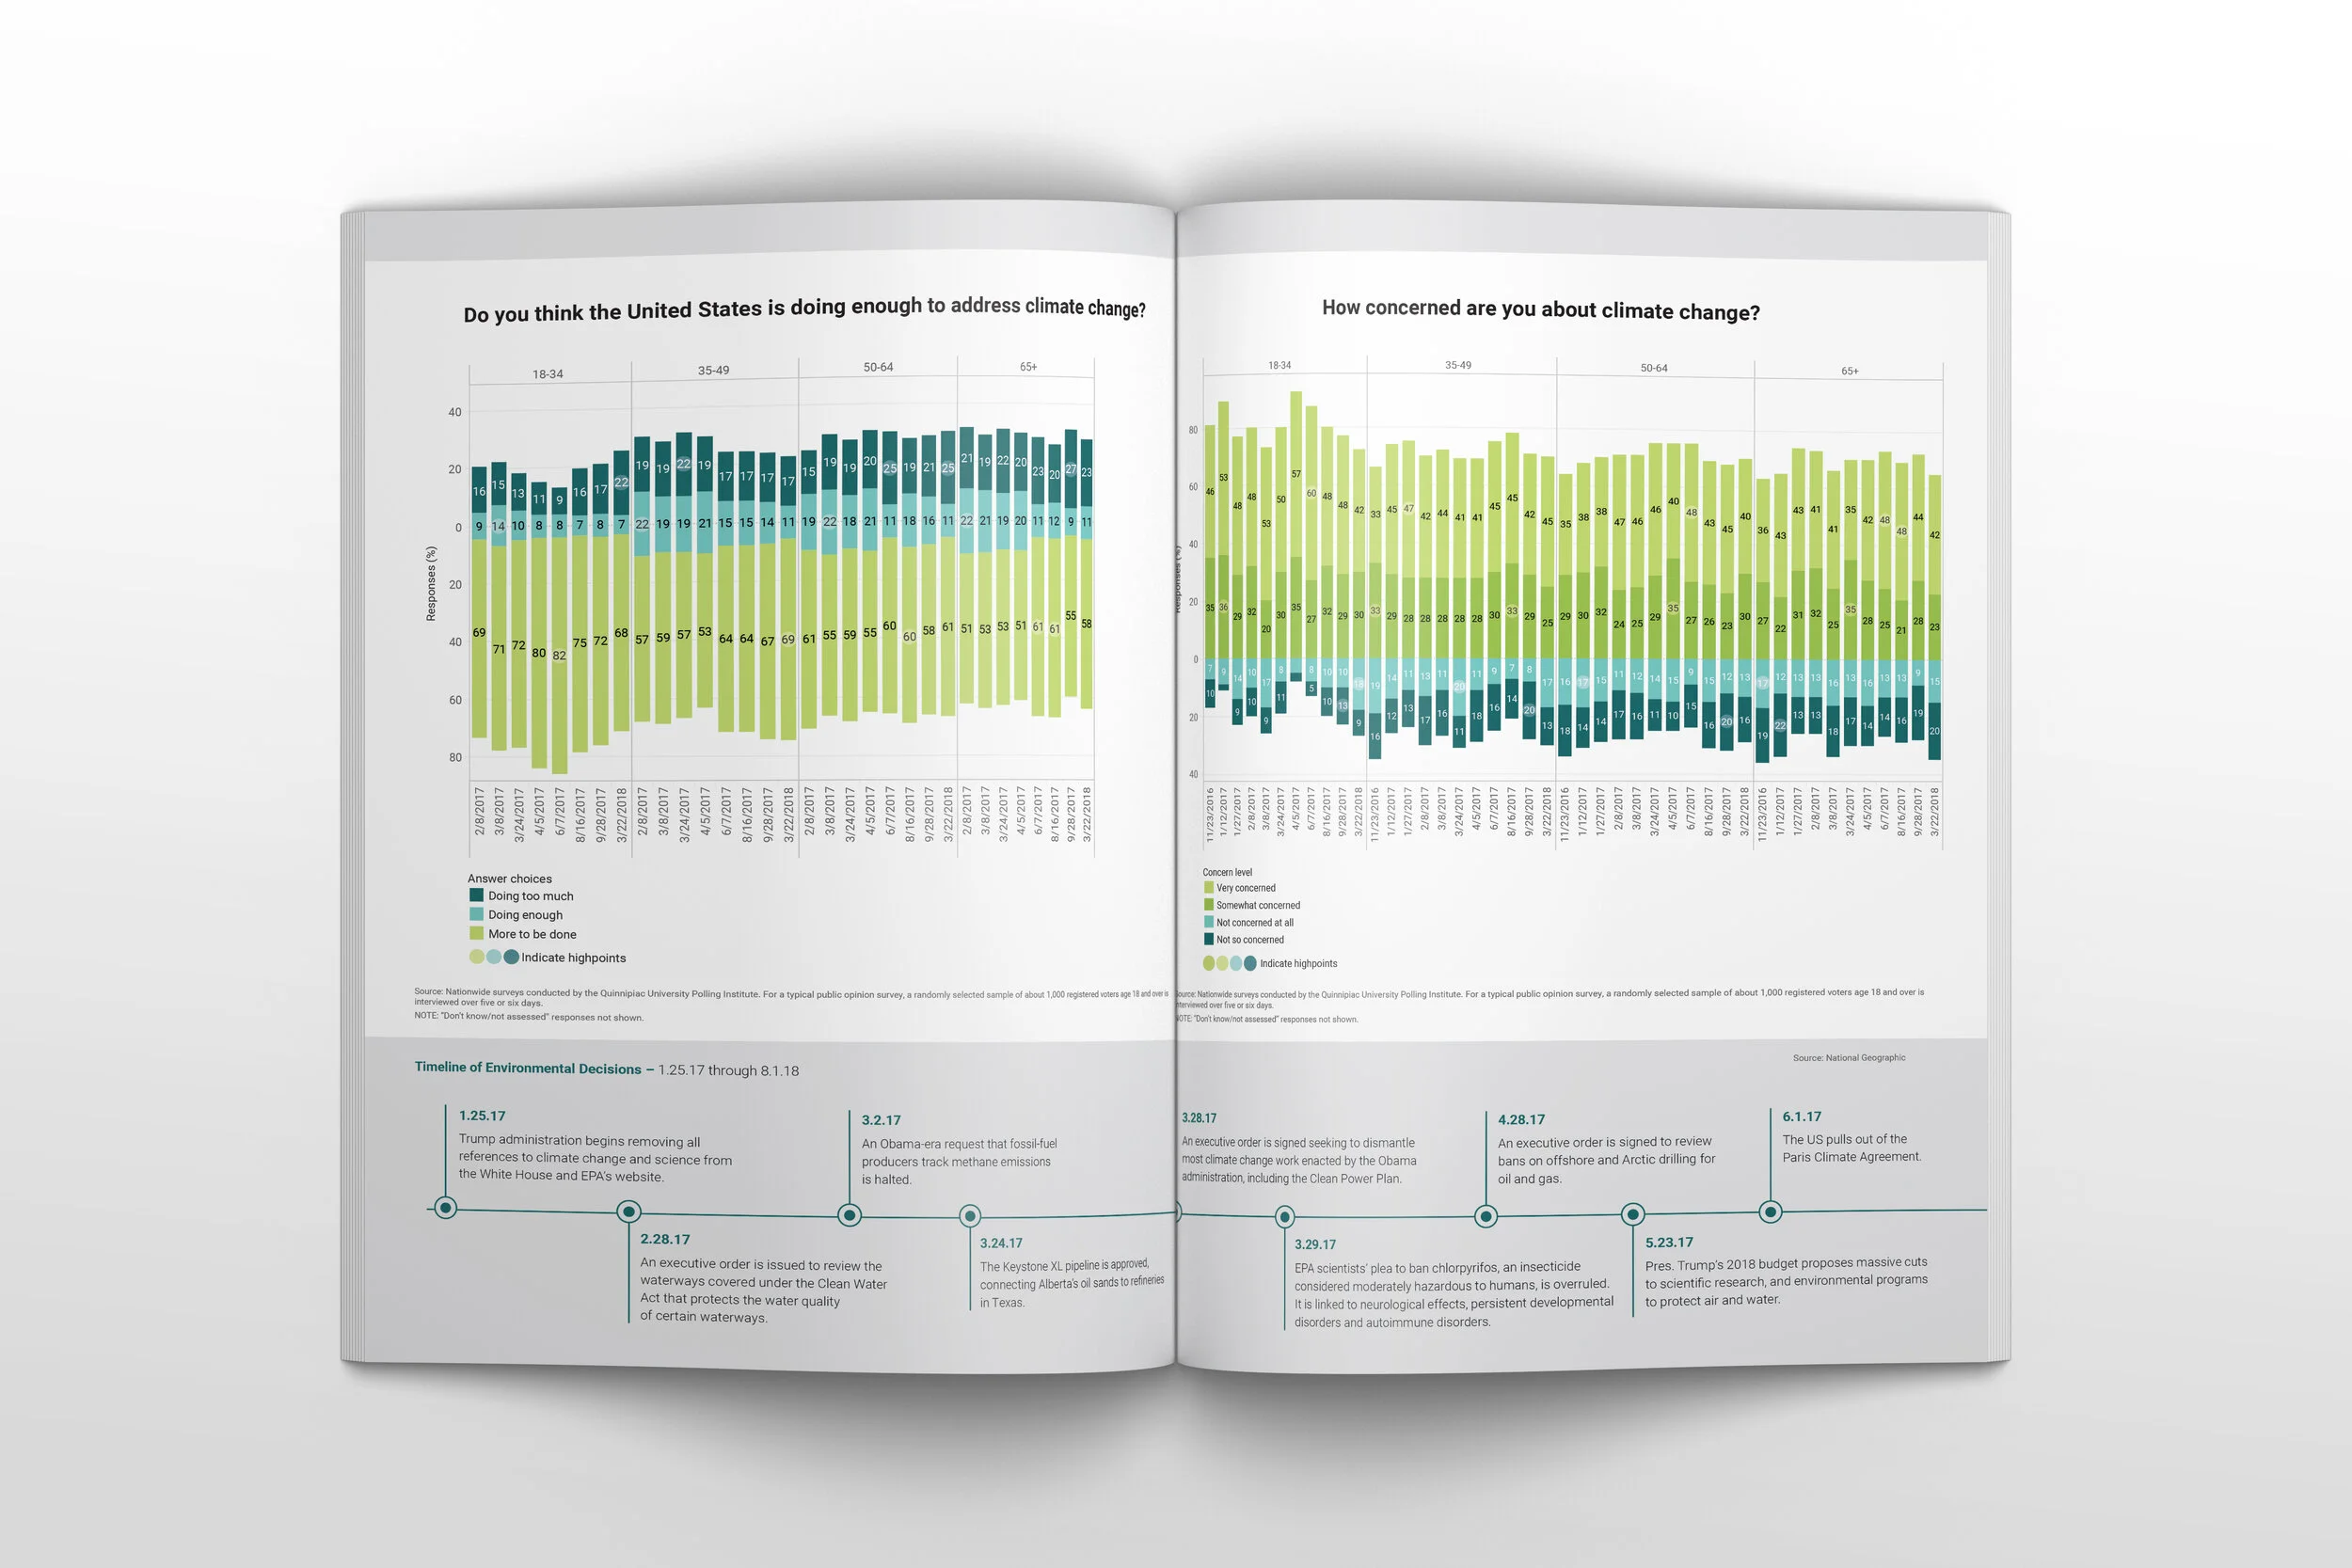
Data compare responses from different age groups over time. A timeline of key events and policies since the 2016 presidential election line the bottom of the spread.
Whenever possible, a topic concludes with a comparison to global peers related to the polling questions. For the Environment section, global carbon emissions is highlighted.
The Healthcare section's terms clarify the highly-debated American healthcare system and help young voters understand how they will be impacted as adults off of parent coverage.
Global healthcare data shows cost per capita and life expectancy.
The guide includes a section on exactly how the midterm elections work, which seats are voted on in 2018, and why midterms shouldn't be 'skipped' by voters.


